Understanding electronics asset disposition (EAD) services pricing is crucial for organizations seeking to optimize their technology lifecycle management while maintaining compliance and maximizing value recovery. This comprehensive guide examines all aspects of EAD pricing to help you make informed decisions.
According to the U.S. Environmental Protection Agency, proper electronics stewardship requires adherence to specific regulations and best practices to ensure environmental protection and data security¹. Organizations must carefully evaluate EAD service providers to ensure compliance with these federal guidelines while optimizing their investment.
EAD Services Pricing Quick Reference
| Service Level | Basic Recycling | Enhanced Processing | R2 Certified | Premium Services |
|---|---|---|---|---|
| Price Range | $3-8 per device | $8-15 per device | $15-25 per device | $25-50 per device |
| Data Destruction | Software wipe | Certified wipe | DOD-level | Physical destruction |
| Compliance | Basic | Enhanced | R2 certified | Full compliance |
| Value Recovery | 20-40% | 40-60% | 60-80% | 80%+ optimization |
| Best For | Low-value devices | Standard business | Regulated industries | High-security needs |
12 Key Pricing Factors That Impact EAD Costs
Volume-Based Pricing Tiers
1. Annual Volume Thresholds
- Under 1,000 devices: Standard pricing (no discounts)
- 1,000-5,000 devices: 10-15% volume discount
- 5,000-25,000 devices: 15-25% volume discount
- 25,000-100,000 devices: 25-35% volume discount
- 100,000+ devices: 35-50% volume discount + custom pricing
2. Device Type Complexity
- Smartphones/Tablets: $5-15 per device
- Laptops/Desktops: $8-20 per device
- Servers/Enterprise: $25-75 per device
- Medical Equipment: $50-200 per device
- Specialized Electronics: Custom pricing required
3. Geographic Coverage Requirements
- Local/Regional: Standard transportation costs
- National: 15-25% premium for logistics
- International: 25-50% premium for shipping/compliance
- Remote Locations: Additional fees $2-10 per device
- Expedited Service: 50-100% premium for rush processing
Compliance and Certification Premiums
4. R2 Certification Requirements
- Basic Processing: No certification premium
- R2 Certified: 20-50% premium over basic
- Enhanced R2: 30-60% premium with additional services
- Industry-Specific: 40-70% premium for specialized compliance
- Government/Military: 75-150% premium for security requirements
5. Data Destruction Levels
- Software Wipe: $1-3 per device
- DOD 3-Pass: $3-7 per device
- DOD 7-Pass: $5-10 per device
- Physical Destruction: $8-20 per device
- Certified Destruction: $10-25 per device with documentation
6. Industry-Specific Compliance
- Healthcare (HIPAA): 25-40% premium
- Financial (SOX): 30-50% premium
- Government: 50-100% premium
- Legal/Professional: 20-35% premium
- Education: 15-25% premium
Transportation and Logistics Costs
7. Collection and Shipping
- Local Pickup: $50-200 per pickup
- Regional Shipping: $1-3 per device
- National Shipping: $2-5 per device
- Secure Transport: 25-75% premium
- White Glove Service: 100-200% premium
8. Packaging and Handling
- Standard Packaging: $0.50-2 per device
- Secure Packaging: $1-4 per device
- Specialized Handling: $2-8 per device
- Hazmat Processing: $5-15 per device
- Custom Requirements: Variable pricing
Value Recovery and Revenue Sharing
9. Remarketing Value Potential
- High-Value Devices: 60-80% original value recovery
- Mid-Range Devices: 40-60% original value recovery
- Older Devices: 20-40% original value recovery
- Damaged Devices: 10-25% parts/materials value
- End-of-Life: 5-15% materials recovery only
10. Revenue Sharing Models
- Standard Sharing: 60-70% to customer
- Volume Bonus: 70-80% for large volumes
- Premium Devices: 75-85% for high-value items
- Guaranteed Minimum: Fixed price regardless of recovery
- Market Risk Sharing: Variable based on market conditions
11. Processing Timeline Impact
- Standard Processing: 10-15 business days
- Expedited Service: 5-7 days (50% premium)
- Rush Processing: 2-3 days (100% premium)
- Same-Day Service: 24 hours (200% premium)
- Delayed Processing: 20+ days (10-20% discount)
12. Service Scope and Add-Ons
- Basic Service: Collection, wipe, recycle
- Enhanced Service: +reporting, tracking (+20-30%)
- Premium Service: +compliance, optimization (+40-60%)
- Full-Service: +logistics, consulting (+60-100%)
- Custom Solutions: Variable pricing based on requirements
Detailed Cost Breakdown by Service Provider
OEMSource Pricing Structure
Processing Fees:
- Standard Devices: $12-18 per device
- Enterprise Equipment: $25-45 per device
- Specialized Items: Custom pricing
- Volume Discounts: Up to 40% for large volumes
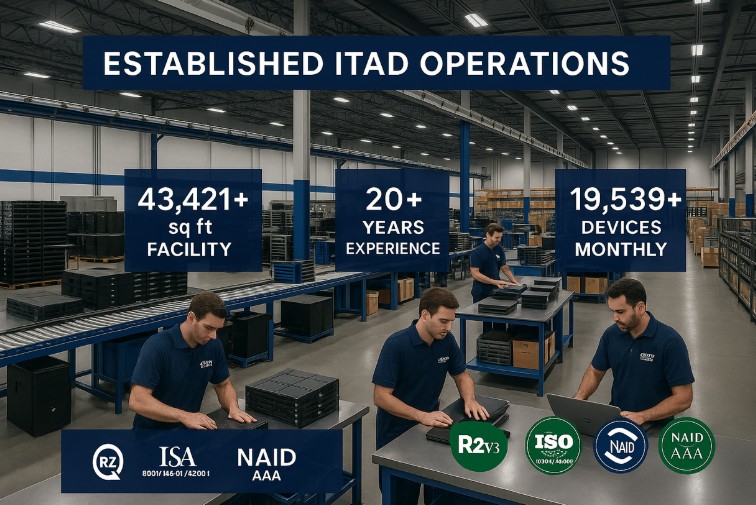
- R2 Certification: Included in all services
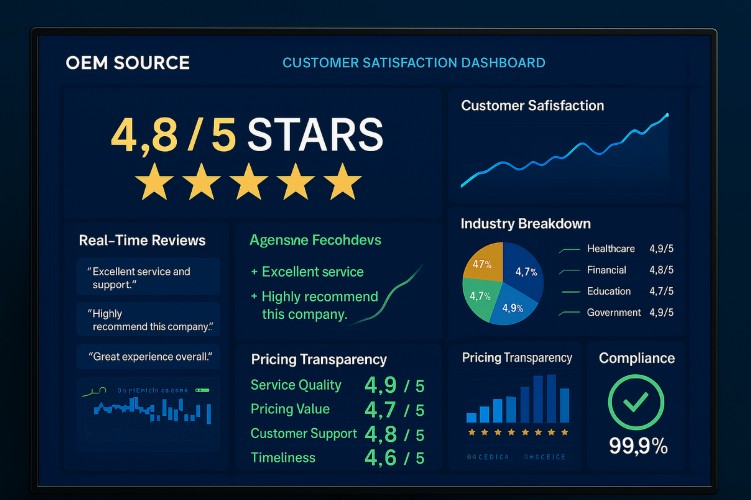
Value Recovery Performance:
- Average Recovery Rate: 65-75%
- Revenue Sharing: 70-80% to customer
- Market Optimization: Real-time pricing
- Global Channels: 50+ country network
- Guaranteed Minimums: Available for contracts
Additional Services:
- Certified Data Destruction: Included
- Compliance Documentation: Included
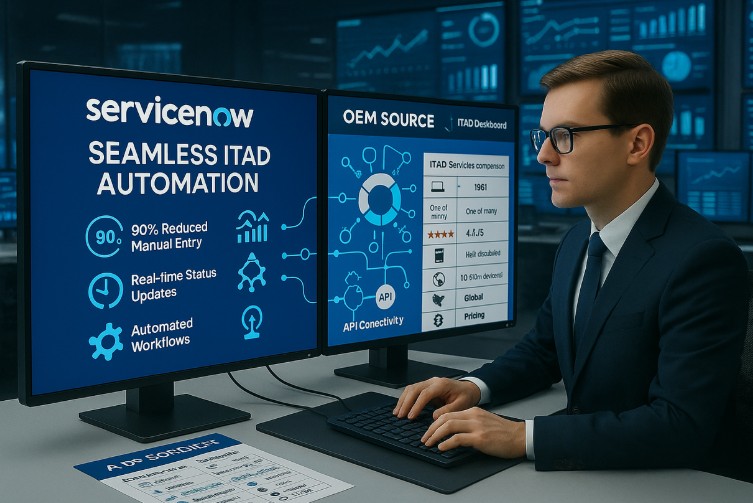
- Real-Time Tracking: Included
- Custom Reporting: Included
- Account Management: Included
For more information about comprehensive EAD solutions, visit OEMSource to explore their full range of certified electronics asset disposition services.
Competitor Pricing Comparison
Generic R2 Providers:
- Processing Fees: $8-15 per device
- Value Recovery: 45-60% rates
- Revenue Sharing: 60-70% to customer
- Additional Costs: Compliance, reporting, tracking
- Total Cost Impact: Often 20-30% higher than quoted
Non-Certified Providers:
- Processing Fees: $5-10 per device
- Value Recovery: 30-50% rates
- Compliance Risks: Potential penalties/liability
- Hidden Costs: Additional services required
- True Cost: Often exceeds certified providers
Industry-Specific Pricing Analysis
Healthcare Organizations
Typical Volume: 5,000-50,000 devices annually
Pricing Requirements:
- HIPAA Compliance: Mandatory (25-40% premium)
- Medical Device Handling: Specialized processing
- Audit Documentation: Comprehensive reporting
- Risk Mitigation: Liability protection essential
- Regulatory Support: Ongoing compliance assistance
OEMSource Healthcare Pricing:
- Base Processing: $15-22 per device
- HIPAA Compliance: Included
- Medical Specialization: Included
- Audit Support: Included
- Total Value: Superior to alternatives
Cost-Benefit Analysis:
- Compliance Assurance: Avoids $100K-500K penalties
- Risk Mitigation: Prevents data breach costs
- Operational Efficiency: Reduces internal overhead
- Professional Credibility: Maintains reputation
- ROI: Typically 200-400% return on investment
Financial Services
Typical Volume: 10,000-100,000 devices annually
Pricing Drivers:
- SOX Compliance: Required (30-50% premium)
- Enhanced Security: DOD-level destruction
- Audit Requirements: Detailed documentation
- Expedited Processing: Time-sensitive needs
- Risk Management: Comprehensive protection
Financial Services Pricing:
- Processing Fees: $18-28 per device
- Security Premium: Included in R2 certification
- Audit Documentation: Comprehensive
- Expedited Options: Available
- Risk Coverage: Full liability protection
Value Proposition:
- Regulatory Compliance: Meets all requirements
- Data Security: Highest standards
- Audit Readiness: Complete documentation
- Risk Mitigation: Comprehensive protection
- Operational Efficiency: Streamlined processes
Wireless Carriers
Typical Volume: 100,000-1,000,000+ devices annually
Specialized Requirements:
- Massive Scale: High-volume processing
- Value Optimization: Maximum recovery essential
- Rapid Processing: Quick turnaround needed
- Geographic Coverage: National logistics
- Carrier Expertise: Industry specialization
Carrier Pricing Structure:
- Volume Discounts: 35-50% off standard rates
- Processing Efficiency: $8-15 per device
- Value Recovery: 70-80% rates
- Revenue Sharing: 75-85% to carrier
- Specialized Services: Carrier-specific solutions
Financial Impact:
- Volume Savings: $2-5M annually
- Value Recovery: $10-20M additional revenue
- Operational Efficiency: 40-60% improvement
- Risk Mitigation: Comprehensive protection
- Net Benefit: $15-30M annual value
Cost Optimization Strategies
10 Ways to Reduce EAD Costs
1. Volume Consolidation
- Combine multiple locations
- Annual volume commitments
- Coordinate timing across departments
- Negotiate volume discounts
- Potential Savings: 15-40%
2. Service Scope Optimization
- Match services to actual needs
- Avoid over-specification
- Focus on essential requirements
- Eliminate unnecessary add-ons
- Potential Savings: 10-25%
3. Geographic Consolidation
- Regional collection strategies
- Consolidated shipping
- Optimize pickup routes
- Reduce transportation costs
- Potential Savings: 20-35%
4. Timing Optimization
- Avoid peak periods
- Plan processing schedules
- Coordinate with market conditions
- Optimize value recovery timing
- Potential Savings: 5-15%
5. Provider Selection
- Compare total value proposition
- Evaluate all-inclusive pricing
- Consider long-term partnerships
- Negotiate comprehensive agreements
- Potential Savings: 15-30%
6. Contract Negotiation
- Multi-year agreements
- Volume commitments
- Performance incentives
- Risk sharing arrangements
- Potential Savings: 10-25%
7. Process Standardization
- Standardize device preparation
- Streamline collection procedures
- Optimize packaging methods
- Reduce handling complexity
- Potential Savings: 5-20%
8. Technology Utilization
- Automated tracking systems
- Self-service portals
- Digital documentation
- Real-time monitoring
- Potential Savings: 10-20%
9. Value Recovery Focus
- Optimize device condition
- Time market disposition
- Maximize remarketing value
- Enhance revenue sharing
- Potential Savings: 20-50%
10. Risk Management
- Comprehensive insurance
- Liability protection
- Compliance assurance
- Professional indemnification
- Potential Savings: Avoid major losses
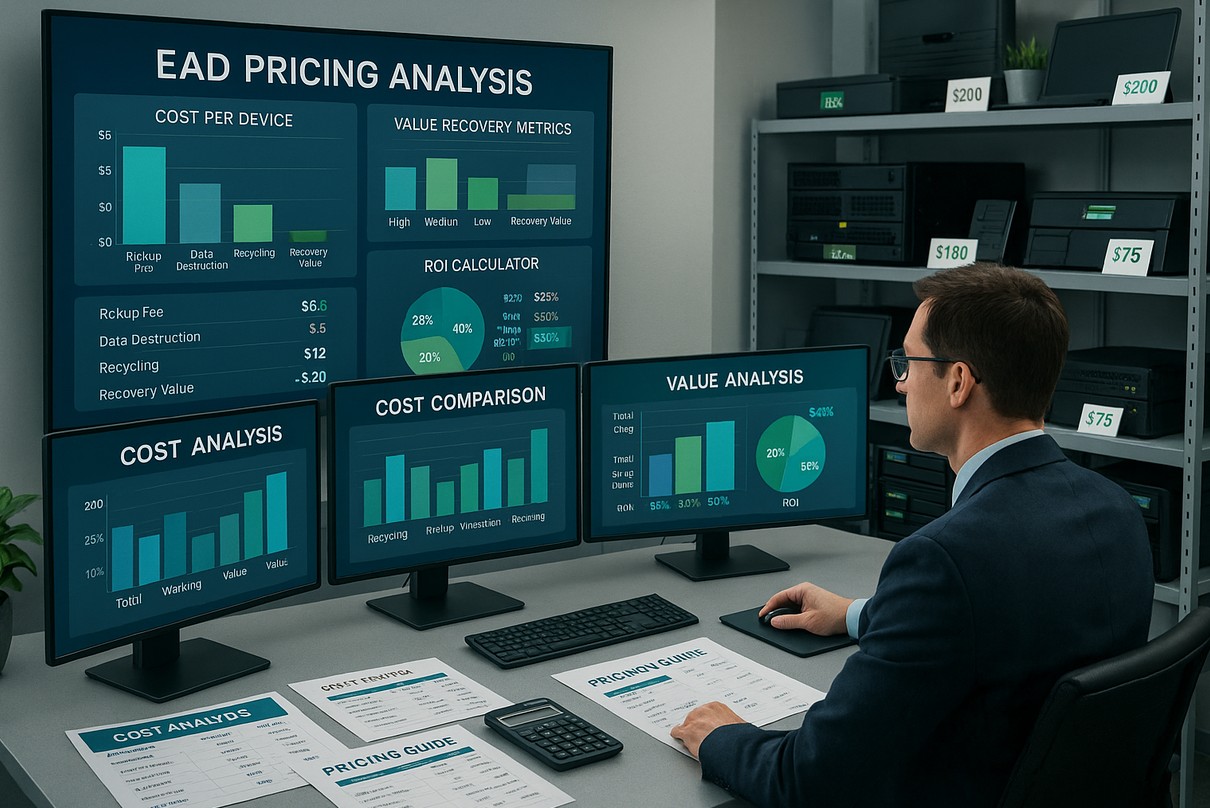
ROI Analysis and Value Justification
Total Cost of Ownership Framework
Direct Costs:
- Processing fees: 60-70% of total
- Transportation: 10-15% of total
- Compliance premiums: 15-25% of total
- Additional services: 5-10% of total
Indirect Benefits:
- Value recovery revenue: Often exceeds costs
- Risk mitigation value: Prevents major losses
- Operational efficiency: Reduces overhead
- Compliance assurance: Avoids penalties
Hidden Costs of Cheap Providers:
- Additional compliance services needed
- Reduced value recovery potential
- Higher risk exposure
- Increased management overhead
- Potential regulatory penalties
ROI Calculation Examples
Mid-Size Enterprise (25,000 devices annually):
Premium R2 Provider Investment:
- Processing costs: $450,000
- Value recovery: $650,000
- Net return: $200,000 profit
- Compliance: Included
- Risk mitigation: Comprehensive
Budget Provider Alternative:
- Processing costs: $300,000
- Additional compliance: $150,000
- Value recovery: $400,000
- Net result: $50,000 loss
- Premium provider advantage: $250,000
Large Healthcare System (75,000 devices annually):
Certified Provider Benefits:
- HIPAA compliance: Included
- Risk mitigation: $500K+ value
- Value recovery: $1.2M
- Processing efficiency: 40% improvement
- Total annual value: $2M+
Non-Certified Risks:
- Compliance gaps: Potential $1M+ penalties
- Data breach risk: $5M+ potential cost
- Audit failures: Operational disruption
- Reputation damage: Immeasurable cost
- Risk exposure: $10M+ potential
Future Pricing Trends
Market Evolution Factors
Regulatory Expansion:
- Increasing compliance requirements
- Enhanced data protection laws
- Stricter environmental standards
- Industry-specific regulations
- Impact: 10-20% annual cost increases
Technology Advancement:
- Processing automation
- Value recovery optimization
- Efficiency improvements
- Cost reduction opportunities
- Impact: 5-15% annual cost reductions
Market Consolidation:
- Fewer qualified providers
- Increased specialization
- Premium for certified services
- Enhanced service quality
- Impact: Mixed pricing effects
Sustainability Focus:
- Circular economy emphasis
- Enhanced remarketing
- Value recovery improvements
- Environmental compliance
- Impact: Better value recovery offsetting costs
5-Year Pricing Outlook
2025-2027: Regulatory Expansion
- Compliance costs increase 15-25%
- Certified providers gain premium
- Non-certified providers struggle
- Market consolidation accelerates
2027-2029: Technology Maturation
- Processing costs stabilize
- Value recovery improves 20-30%
- Automation reduces labor costs
- Service quality enhances
2029-2030: Market Optimization
- Pricing stabilizes at higher levels
- Value recovery maximizes
- Service differentiation increases
- Premium for specialization
Vendor Selection Decision Matrix
Evaluation Criteria Scoring
| Criteria | Weight | OEMSource | Competitor A | Competitor B |
|---|---|---|---|---|
| R2 Certification | 20% | 10/10 | 8/10 | 6/10 |
| Processing Capacity | 15% | 10/10 | 7/10 | 5/10 |
| Value Recovery | 20% | 9/10 | 6/10 | 5/10 |
| Geographic Coverage | 10% | 9/10 | 7/10 | 4/10 |
| Industry Expertise | 15% | 10/10 | 5/10 | 3/10 |
| Technology Platform | 10% | 9/10 | 6/10 | 4/10 |
| Pricing Competitiveness | 10% | 8/10 | 9/10 | 10/10 |
| Total Weighted Score | 100% | 9.3/10 | 6.7/10 | 5.4/10 |
Decision Framework
Choose Premium Provider (OEMSource) When:
- Compliance requirements are strict
- Value recovery is important
- Risk mitigation is essential
- Professional reputation matters
- Long-term partnership desired
Consider Budget Providers When:
- Compliance requirements minimal
- Low-value devices only
- Cost is primary concern
- Risk tolerance is high
- Short-term needs only
Conclusion: Optimizing EAD Investment
Electronics asset disposition services pricing reflects the complexity and value of comprehensive electronics lifecycle management. Organizations must consider total cost of ownership including direct costs, indirect benefits, and value recovery opportunities to make informed decisions.
Key Pricing Insights:
Cost Factors:
- Volume discounts can reduce costs 15-50%
- R2 certification adds 20-50% premium but provides essential value
- Industry compliance requirements add 25-70% but prevent major risks
- Geographic coverage impacts costs 15-50% based on scope
- Service level selection affects total costs 30-100%
Value Optimization:
- Superior providers often deliver better net returns despite higher fees
- Value recovery can offset processing costs entirely
- Risk mitigation prevents potentially catastrophic losses
- Operational efficiency reduces internal management costs
- Professional reputation protection provides immeasurable value
Strategic Recommendations:
- Invest in certified providers for regulated industries
- Prioritize value recovery capabilities over low processing fees
- Consider total cost of ownership rather than simple fee comparison
- Negotiate comprehensive agreements for better value
- Focus on long-term partnerships with proven providers
The Bottom Line:
While premium EAD services command higher processing fees, the comprehensive benefits including superior value recovery, risk mitigation, and operational efficiency often provide better total value than budget alternatives. Organizations should evaluate providers based on total value delivery rather than simple cost comparison to achieve optimal outcomes for their electronics asset disposition programs.
Organizations investing in premium EAD services report:
- 20-40% better value recovery rates
- 100% regulatory compliance confidence
- Significant risk mitigation benefits
- Operational efficiency improvements
- Enhanced professional credibility
- Superior long-term partnership value
For organizations serious about optimizing their electronics asset disposition programs, investing in certified providers with proven capabilities delivers superior outcomes while maintaining the highest standards of compliance, security, and value recovery.